Wednesday, July 27, 2016

L&T Finance Holdings Ltd. : Growth Candidate

Hello All, 

Today's Stock Pick : L&T Finance Holdings Ltd. 


The Stock is Considered to be a Slow Mover in the Segment. The Name of L&T is enough for growth, but overall the Segment is growth oriented and L&T FH is a safe player in the segment. Growth is seen on Charts and Potential upside will be good. 


Let's See the Chart 


This is a Weekly Chart, and as we see, We have witnessed a Breakout from falling trend already somewhere in April-May 2016 around 67 levels and the stock has moved to almost 85 levels today.. Nearly 30% growth since the breakout. But the Growth story is not over yet, we are witnessing a foundation for future growth potential. 

After the breakout from Falling channel, the stock moved in a smaller rising channel forming a "Flag Pattern" on the chart. Today on 27th July the stock witnessed a Sharp breakout from the Flag Pattern with a 8%+ move in a day. 

The FLAG Pattern Breakout targets a Price movement of Nearly 15-20 Rs. and  the Target comes around 97 which is previous high and there after -102 - 110 levels, may be more will come, but we will revisit the Charts after our targets are done. 


One Request to you all... If you Find the Article Good and Helping, Please Share it through Facebook, Google+, Twitter or Mail it to your Friends By Clicking the small icons below this post... We are helping you grow your portfolio, Help us in growing our followers. (without changing anything in the post)

Recommendation ::

BUY AND ACCUMULATE L&T FINANCE HOLDINGS LTD. in the range of 82-84 with a Stoploss of 78 and Take Profits around 97 - 102 -110+ 

The Risk Reward is good enough to Keep invested... !! 


These are all Technical Views which are based on Daily Charts, indicating any price movement towards the Targets will take time and it is not expected to move in a Single day. So Do not enter with speculative bets in the trade. These recommendations are purely for Investment purpose. 

Follow Strict Risk Management Before Entering the Trades and Consult your Investment Adviser for guidelines. "Do not jump in the trade" without considering the risk. 

Enjoy Trading, Trade Safe, Trade Wisely !! 

________________________________________________________________

Disclaimer : 
The Analyst May or May not have trading positions or Investments in suggested Instrument, The Trade is Long Term and the Analyst may recommend the trade to his clients time to time for short term trading. short term reversal trades May be advised in this duration and it will be according to the charts. 

The Analyst is a SEBI Certified Investment Adviser and Global Market Expert having Vast experience of Financial Markets in India and Across the Globe. Running Analysis Services and Advisory since Last 6 years for clients across the world in Stock Markets, Forex, and Commodities. 

Contact Details :: 
WhatsApp & Telegram +91 8275 298 208 /  Email : 4x.magician@gmail.com   
________________________________________________________________


Tuesday, July 26, 2016

ADANI Enterprises Ltd. : Turnaround for Investors ??

Hello Friends, 

Today's Stock Pick : ADANI ENTERPRISES LTD. 

The Stock is Trading Very Range Bound since the Seperation of Unit and Lost the fancy. For me Good Accumulation is going on by big investors and we might see a turnaround story very soon.. May be the stock will start moving for Traders and Investors..

Let's See the Chart 


as per the chart, Stock is moving in a Triangle Formation and simultaneously created a Inverse Head and Shoulder Pattern supporting potential upside. 

Price is trying to breakout above the Falling Trendline and it will ultimately support the Inverted Head and Shoulder Breakout, Targeting atleast 30 Rs. upside in the stock according to the current price of 83, it will be an upside of nearly 40% from current price. 

Recommendation : 

BUY AND ACCUMULATE ADANI ENTERPRISES LTD. in the Range of 80-82 with a Stoploss of around 76 and a Take Profit of 90 - 104 - 112 - 120+ 

Whatever News or Fundamentals do, For me 6 Rs. Risk in this Stock is good for Potential upside and Stoploss may be trailed later.. 

These are all Technical Views which are based on Daily Charts, indicating any price movement towards the Targets will take time and it is not expected to move in a Single day. So Do not enter with speculative bets in the trade. These recommendations are purely for Investment purpose. 

Follow Strict Risk Management Before Entering the Trades and Consult your Investment Adviser for guidelines. "Do not jump in the trade" without considering the risk. 

Enjoy Trading, Trade Safe, Trade Wisely !! 

________________________________________________________________

Disclaimer : 
The Analyst May or May not have trading positions or Investments in suggested Instrument, The Trade is Long Term and the Analyst may recommend the trade to his clients time to time for short term trading. short term reversal trades May be advised in this duration and it will be according to the charts. 

The Analyst is a SEBI Certified Investment Adviser and Global Market Expert having Vast experience of Financial Markets in India and Across the Globe. Running Analysis Services and Advisory since Last 6 years for clients across the world in Stock Markets, Forex, and Commodities. 

Contact Details :: 
WhatsApp & Telegram +91 8275 298 208 /  Email : 4x.magician@gmail.com   
________________________________________________________________


Sunday, July 24, 2016

RCF Ltd.


Good Morning All !! 

Today's Pick : RCF Ltd. 

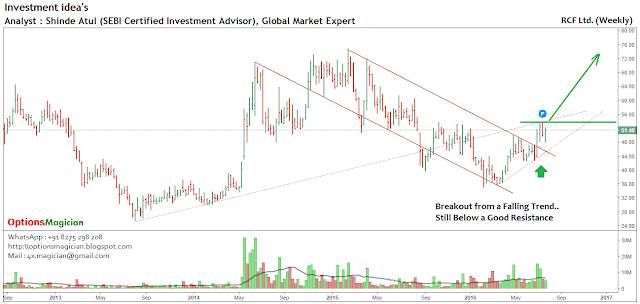
Fertilizer Stocks are out of frenzy now a days. India Growth story, Good Monsoon, Focus on Infrastructure development and other factors are pushing Agricultural developments and are expected to boost the Fertilizers Sector. As per the chart, The Stock is expected to perform well. 

Lets See .. 


As per the Weekly Chart as shown above the Stock has moved out of the falling channel indicating the down trend is over now and the stock may start moving in a rising channel, but the previous rising trendline is Just above the current price and it will act as a tough resistance to cross immediately. Once the Resistance is crossed and sustained, we will find the stock moving in an open territory on higher side. 


In a Daily Chart, The Price has performed well creating a Cup and Handle Chart Pattern at the bottom levels and while breakout from the falling trend. The height of the cup is approx 16 points or 16 rupees. The Price Target comes around 66 levels according to Neckline at 50 levels. The immediate resistance of 54 area will work fine and won't allow Markets to go above that level easily. 

Recommendation : 

BUY and Accumulate RCF Ltd. in 48-51 zone with a stoploss at 45 level and Price Target of 54 - 58 - 62 - 66. 

Upside Potential is 30% approximately and Risk is About 10% of the Invested Capital. Many Investors do not like this sector, so they are advised to stay away from this counter and wait for another opportunity. 

These are all Technical Views which are based on Daily Charts, indicating any price movement towards the Targets will take time and it is not expected to move in a Single day. So Do not enter with speculative bets in the trade. These recommendations are purely for Investment purpose. 

Follow Strict Risk Management Before Entering the Trades and Consult your Investment Adviser for guidelines. "Do not jump in the trade" without considering the risk. 

Enjoy Trading, Trade Safe, Trade Wisely !! 

________________________________________________________________

Disclaimer : 
The Analyst May or May not have trading positions or Investments in suggested Instrument, The Trade is Long Term and the Analyst may recommend the trade to his clients time to time for short term trading. short term reversal trades May be advised in this duration and it will be according to the charts. 

The Analyst is a SEBI Certified Investment Adviser and Global Market Expert having Vast experience of Financial Markets in India and Across the Globe. Running Analysis Services and Advisory since Last 6 years for clients across the world in Stock Markets, Forex, and Commodities. 

Contact Details :: 
WhatsApp & Telegram +91 8275 298 208 /  Email : 4x.magician@gmail.com   
________________________________________________________________


Wealth Creation : Entries Open

Hello All, 

Due to Heavy Demand from Many Members and Investors. We are Opening Entries for our Wealth Creation Pack (NSE Options) 

We are Taking up Only 10 Entries .. 

First Lucky 10 Members will get Chance to Join the Wealth Creation Pack and Will be able to Create Wealth without any Worries... !! 

The Requirements are as Follows : 


  • Minimum Investment : 1 Lac. 
  • Trading Instrument : Index and Stock Options. 
  • Trading Style : Longs Only 
  • Trading Period : 12 Months 
  • Expected Returns : 1000% in 12 months 
  • Initial Fees : 30000/- 
  • Recurring Fees: Profit Sharing Basis. 30% of Profit taken as working Fees.

No Negotiations on Fees and Capital Requirements, Please. 

Clients Willing to Join the Wealth Creation Pack will need to complete procedures and start before 05th of August 2016  


For More details : 

Send a Mail to 4x.magician@gmail.com / admin@fxmagician.com 
WhatsApp : +91 8275 298 208 

HURRY !! ... It's a Limited Period Opportunity !! 


Thursday, July 21, 2016

Federal Bank Ltd.

Hello Again, 


Today's Pick : FEDERAL BANK LTD. 

Banking Stocks are On a upmove since a few weeks, Most of the Banks rallied strong, Few are still left out and few are on the verge of "Big Breakouts"  

Federal bank is One of the Banks, who are now moving towards massive breakouts.. although the upmove from lows is decent, there is still a scope of growth for the stock. 

Let's See the charts on Daily Time frame.. 


in the First Chart We see a clear trend breakout from a falling trend to a rising trend or an uptrend. The Price is moving in a Rising Channel and moving in correct technical setup. at current position the price has reached the Resistance zone of 60-64 level and consolidating in the zone. Any Break above 64 will be big. 


in the second chart, we find a Strong Chart patter on Inverted Head and Shoulder. The Pattern is Highly successful and the price Target according to the pattern comes around 80 levels. The 80 Level  will be very crucial and break above the level will lead the stock to rally further to 120+ levels. The Reasons? will update once we reach the 80+ level :)... Stay Tuned !! 


These are all Technical Views which are based on Daily Charts, indicating any price movement towards the Targets will take time and it is not expected to move in a Single day. So Do not enter with speculative bets in the trade. These recommendations are purely for Investment purpose. 

Recommendation : 

BUY FEDERAL BANK LTD. at 58-61 range, with a Stoploss of 53 Rupees and a Price Target of 68 - 74 - 88 and Later 120+ 

Book at least 30% profits around 75+ levels and move stoploss for remaining qty around 64 levels to hold remaining qty.

Follow Strict Risk Management Before Entering the Trades and Consult your Investment Adviser for guidelines. "Do not jump in the trade" without considering the risk. 

Enjoy Trading, Trade Safe, Trade Wisely !! 

________________________________________________________________

Disclaimer : 
The Analyst May or May not have trading positions or Investments in suggested Instrument, The Trade is Long Term and the Analyst may recommend the trade to his clients time to time for short term trading. short term reversal trades May be advised in this duration and it will be according to the charts. 

The Analyst is a SEBI Certified Investment Adviser and Global Market Expert having Vast experience of Financial Markets in India and Across the Globe. Running Analysis Services and Advisory since Last 6 years for clients across the world in Stock Markets, Forex, and Commodities. 

Contact Details :: 
WhatsApp & Telegram +91 8275 298 208 /  Email : 4x.magician@gmail.com   
________________________________________________________________


DB Reality Ltd. .. Growth Candidate ??

Hello Friends,

Today's Pick : DB Reality Ltd. 

The Stock is not much on radar of retails investors, Found it While tracking Real Estate Stocks. 
Looking amazing on charts.. For me Charts are everything as they reflect everything happening in the stock. Unfortunately in Indian Markets we find lack of liquidity which sometimes can lead to Manipulation in stock prices. But as I said, Charts predict everything and they tell us the accumulation in stocks well before the move stocks. Finding such stocks is a little tough process as in Bull Market everything moves up and you have to search real "Breakouts". 

Let's See What charts say : 

We will look at the Daily Charts in this case for a clear long term view.. 


First Chart shows a Long term Falling trend, exactly following the trend line, at the recent period, stock has given a breakout from the falling trend after a consolidation move for last few months. The Stock might be accumulated by the Investors for a good long run. The Volume are rising in this counter is an addition to the confirmation.    


In the Second chart which is also on the daily time frame, we see a chart formation while breaking out from the falling trend. the Chart Formation is "Inverted Head and Shoulder" pattern which is considered highly reliable and gives good results. The Price got a Breakout from the Neckline of the Head & Shoulder Pattern around 55 levels and the Height of the Head area is approximately 22 points or 22 Rs. Which gives a Price Target of approx 77 rupees for the Stock. 


The Third Chart is same chart focused on the latest developments.. Here we see a Strong Pin Bar Reversal near the Lows and High Volumes supporting the breakout of the stock from falling trend. Simultaneously the stock is forming a FLAG pattern with a pole height of approx 15-16 points. It is assumed that the price will move by min 15-16 points above 57 levels to give a FLAG Breakout. 

These are all Technical Views which are based on Daily Charts, indicating any price movement towards the Targets will take time and it is not expected to move in a Single day. So Do not enter with speculative bets in the trade. These recommendations are purely for Investment purpose. 

Recommendation : 

BUY DB REALITY LTD. at 55-57 range, with a Stoploss of 51 Rupees and a Price Target of 66 - 72 -78 - 88 and Later 100+ 

Book at least 30% profits around 75+ levels and move stoploss for remaining qty around 61 levels to hold remaining qty.

Follow Strict Risk Management Before Entering the Trades and Consult your Investment Adviser for guidelines. "Do not jump in the trade" without considering the risk. 

Enjoy Trading, Trade Safe, Trade Wisely !! 

________________________________________________________________

Disclaimer : 
The Analyst May or May not have trading positions or Investments in suggested Instrument, The Trade is Long Term and the Analyst may recommend the trade to his clients time to time for short term trading. short term reversal trades May be advised in this duration and it will be according to the charts. 

The Analyst is a SEBI Certified Investment Adviser and Global Market Expert having Vast experience of Financial Markets in India and Across the Globe. Running Analysis Services and Advisory since Last 6 years for clients across the world in Stock Markets, Forex, and Commodities. 

Contact Details :: 
WhatsApp & Telegram +91 8275 298 208 /  Email : 4x.magician@gmail.com   
________________________________________________________________


Tuesday, July 19, 2016

BS Ltd.:: upside due

Hello Guys, 

Hope you are trading fine.. 

This Stock is not an A group Stock as I focus regularly. This Stock is not so popular and Volume is also low.. 

The Stock is BS Ltd.

Let's go to the Chart Directly .. Daily Timeframe 


The chart shows a breakout from all possible falling trends. Now Moving in Consolidation in a small range. Price is trading near Lower level in the current channel. Stoploss is small and Targets are Higher.. at the upside of the current channel, the stock may complete a Cup and Handle pattern giving possibilities of more possibilities. 

Recommendation :

BUY BS LTD. around 11 / With a Stoploss of 10 / Take Profit of 14.40 - 15.20 - 17.50 - 20.90 - 24.50 - 30.20 ... 

Follow Strict Risk Management Before Entering the Trades and Consult your Investment Advisor for guidelines. "Do not jump in the trade" without considering the risk. 

Enjoy Trading, Trade Safe, Trade Wisely !! 

________________________________________________________________

Disclaimer : 
The Analyst May or May not have trading positions or Investments in suggested Instrument, The Trade is Long Term and the Analyst may recommend the trade to his clients time to time for short term trading. short term reversal trades May be advised in this duration and it will be according to the charts. 

The Analyst is a SEBI Certified Investment Advisor and Global Market Expert having Vast experience of Financial Markets in India and Across the Globe. Running Analysis Services and Advisory since Last 6 years for clients across the world in Stock Markets, Forex, and Commodities. 

Contact Details :: 
WhatsApp & Telegram +91 8275 298 208 /  Email : 4x.magician@gmail.com   
________________________________________________________________

Thursday, July 14, 2016

Selan : Explore the Opportunity :)

Good Morning Again, 

Stock : SELAN Exploration Ltd.

The Sector is little lagging in Overall Market. 

Charts Look Good as of Now, showing big possibilities ahead, Let's Explore 

Weekly Chart 


Very Long Term and Steep Fall concluded with a breakout and then again resumed to fall more after the breakout before retesting the trendline, It was again a fall as the trendline was very steep falling and to retest the trendline, Price had to go down and touch it. 

The Price has resumed to move up in a slow rising channel, giving a good consolidation before any big breakout. 

Let's see on Daily Timeframe :


The rising channel shows the slow movement in the stock, most probably these kind of moves are developed after a big fall and before a Good breakout, at present stock is in consolidation and any move above the rising channel resistance, i.e. above 220 region will give strength to the stock and there is always a Buying opportunity in the range of 200-205.

Above Rising channel resistance there are big chances of a fast & furious move for higher range and the stock may double in a few months timeframe. 

Recommendation : 

BUY SELAN EXPLORATION LTD in the price range of 200-205 with a Stoploss of 192 and a Price Target of 220 - 240 - 260 

Follow Strict Risk Management Before Entering the Trades and Consult your Investment Advisor for guidelines. "Do not jump in the trade" without considering the risk. 

Enjoy Trading, Trade Safe, Trade Wisely !! 

________________________________________________________________

Disclaimer : 
The Analyst May or May not have trading positions or Investments in suggested Instrument, The Trade is Long Term and the Analyst may recommend the trade to his clients time to time for short term trading. short term reversal trades May be advised in this duration and it will be according to the charts. 

The Analyst is a SEBI Certified Investment Advisor and Global Market Expert having Vast experience of Financial Markets in India and Across the Globe. Running Analysis Services and Advisory since Last 6 years for clients across the world in Stock Markets, Forex, and Commodities. 

Contact Details :: 
WhatsApp & Telegram +91 8275 298 208 /  Email : 4x.magician@gmail.com   
________________________________________________________________

NIFTY : What Next ??

Good Morning All,

Today we will Check about NIFTY, 

Markets are Rallying Hard after Brexit, I have alerted to my International Market clients about this rally too early, when every other analyst was finding reasons to So Short on Market.. I clearly told Markets are in Bull Run and There is an opportunity to Buy on all Dips.. My Recent trades in DOW Jones, DAX, FTSE, FTSEMIB have geerated massive returns in last few days.. For Domestic Markets I was long since a long time. 

While all Indices globally are showing Bull Run on charts also, I don't understand why the so called big analysts on Channels are shouting caution again and again and keeping the small traders away from Market. Don't they see what charts are clearly showing.. 
  
Let's Visit the Chart Directly,


This Nifty Daily Chart shows clear breakout from a falling trend, which is confirmed by retesting the falling trendline. The Index was moving in a rising channel till yesterday and Yesterday it broke out of the channel resistance to give more & stronger upside. 

While breaking out of the falling trend, The Index formed a Chart pattern Inverted Head and Shoulder. The Neckline is placed around 7980 levels whereas the bottom of the Head was around 6850, giving a height of approx 1130 points. Nifty Spent some time to break out from the Neckline area and then reversed after breakout to retest the Neckline. After retesting the Neckline price was pushed higher to confirm the strong resistance has become strong support. 

Considering the fact that Head and Shoulder Target comes around 1130 points above 7980, We get a price target of 9110 region which is near the previous high of Nifty. 

Recommendation : 
Keep HOLD on all Nifty longs with a Target of 9110. 

BUY NIFTY on all dips with a Stoploss around 8510 for current conditions, with price targets of 8650, 8840 levels. We will revisit the trade again later.. But Our Target will remain intact.. 9100+ 

This is the reason, why I have suggested buying Nifty 9000 Call of Dec Series.. which is almost tripled in Value. 

Follow Strict Risk Management Before Entering the Trades and Consult your Investment Advisor for guidelines. "Do not jump in the trade" without considering the risk. 

Enjoy Trading, Trade Safe, Trade Wisely !! 

________________________________________________________________

Disclaimer : 
The Analyst May or May not have trading positions or Investments in suggested Instrument, The Trade is Long Term and the Analyst may recommend the trade to his clients time to time for short term trading. short term reversal trades May be advised in this duration and it will be according to the charts. 

The Analyst is a SEBI Certified Investment Advisor and Global Market Expert having Vast experience of Financial Markets in India and Across the Globe. Running Analysis Services and Advisory since Last 6 years for clients across the world in Stock Markets, Forex, and Commodities. 

Contact Details :: 
WhatsApp & Telegram +91 8275 298 208 /  Email : 4x.magician@gmail.com   
________________________________________________________________

Create Wealth With us ::

Hello Friends, 

The Topic is not related to any analysis, it is about Options Trading.

Recently I Gave Few Option Trading Signals in Free Broadcast list on WhatsApp.

The Signals were as follows 
1) Cairn India 160 Call : 3.5 to 11 (later went to 19+) = Profit = 26,250/-
2) ICICIBank 260 Call : 5 to 11 (2nd Tgt Pending) = Profit = 15,000/-
3) SAIL 50 Call : 1 to 2 (Still Holding for Next Tgt) = Profit = 12,000/- 
4) NIFTY 8500 Call (Aug) : 80 to 240 = Profit = 12,000/-
5) NIFTY 9000 Call (Dec) : 60 to 235 (Still Holding) = Profit = 13,125/-
6) ONGC 240 Call : Holding 
7) HPCL 1100 Call : 12 to 24 = Profit = 8,400/-
8) Banknifty Combo : 50 to 150 = Profit = 4,000/-
9) TCS Combo : Holding 
10) TATACHEM 460 Call : 8 to 12 (Still Holding) = Profit = 6,000/-
-----------------------------------------------------------------------------------------
NET PROFIT =  96,775/-

Imagine Profits after Closing Holding Trades.. All Trades were Given live on WhatsApp to paid as well as Free Members. 

Invested Capital at any point of time for all this Profit was less than 50,000/- & Most of the Trades were positional trades with Single Lot. 

These are the Signals we provide to our Paid Members who are subscribed under "Wealth creation Pack" Requirements for the same are as under : 

Min Investment Required : 1 Lacs. 
Trading Instruments : Index and Stock Options
Period : 12 Months 
Profit Target : 1000% 
Working Pattern : Positional Trades 
Fees : Initial Fees + Profit Sharing 

We are Opening UP For Registration under "Wealth Creation Pack" 

Interested ?? 
We Will Add Only 10 Members :) Hurry up .. First Come, First Serve Basis Only. 

Contact us at : 
WhatsApp & Telegram : +91 8275 298 208 
Mail : 4x.magician@gmail.com

Wednesday, July 13, 2016

TATA Chemicals : Once Again..!!

Hello Once Again, 

Today's Stock : TATA Chemicals Ltd. 

The Stock is in Good Trending Move now, I will Keep the Description part short for this Script.

Let's Go to The Charts 


As per the Charts, The Stock has formed a Inverted Head & Shoulder Pattern and the Neckline is around 440 levels, The Stock has managed to breakout from the level and now trading above it. 

in the other chart, The rising channel shows clear uptrend and a Major Resistance broken up at 440 levels.. 

The Head and Shoulder Height is approx 130 points and Targets for the Stock comes around 570 levels. 

I am Long Term Bullish on the Stock with a Price Target Much Higher than 570.. Will update later .. 

Recommendation :

BUY TATACHEMICALS @ 448-450 levels with a Stoploss around 440-435 levels and a Price Target of 520 - 570 Levels. 

Do not Jump in the Trade without proper analysis and Risk Management. 

PORTFOLIO MANAGEMENT ::

Hello Friends, 

Received Few Queries regarding Portfolio Management Recently. 

Let me clarify things... 

1) I am a Investment Adviser by Profession, To Addition I am a SEBI Certified Investment Adviser. Also Completing the World class certification in Financial Planning CFP. 

2) I have Opted for "Fees Based" Advisory Model where I am not interested in any type of brokerage, Commission, etc. My Advisory service is available on Fees Only Basis, it may include One time, Monthly, Quarterly, Yearly.. any type of duration and in some cases it may be a profit sharing model. 

3) I have been working in International Markets since last 7 years, having clients across the world. 

I have started a Specialized Advisory Service for Indian Stock Market Investors, based on Technical Analysis. 

If you are stuck in stocks, Mutual Funds, Your Portfolio is not giving you expected returns, cluttered by too many stocks, Need a Growth Oriented Investment plan. Need to restructure your portfolio... Don't worry, we will help you out... Just Call or Drop a Mail, See contact details. 

Restructuring a dead Portfolio is always important to activate your idle investment and make it Grow... !! 

Portfolio Size ? ... Do not Worry.. We are Big Enough to Handle Big Funds !!

With us, You are always in Safe Hands. 

& Traders, We have everything for you .. Equity, Futures, Options, Mutual Funds, Currencies, Global Markets, Commodities. 

Contact Details : 
WhatsApp & Telegram : +91 8275 298 208
Email : 4x.magician@gmail.com 


BANK NIFTY : Done or Long Way to Go ??

Hello Again, 

Today's View : BANK NIFTY 

Most of the Traders were Bearish on Nifty, Banknifty and Overall Markets due to #Brexit, #Rexit issues. Analysts and Experts on Blue Channels and Pink Papers never waste the chance of spreading fear among traders and Investors. This time same thing happened, Most of Retail Investors or Traders were on sidelines and Market again proved all so called analysts and experts are on wrong side. All the Global Markets are trading at Highest levels. At this levels, again the Experts advising to be "cautious" in Market. 

Always Remember 
If you are a trader, you are in Market to Take Risk. Without Risk there is no Reward. and Without Fluctuations, there are no possibilities of trades.  
If you are a Investor, you don't need to be cautious about short term fluctuations of the Market, on long term Markets always give superior returns. 

Coming to the Point, BankNifty is most traded Index in Indian Market after Nifty. If we see the Historical price movement on Weekly Chart, it looks superb, No Need to be an expert in analysis. 


The chart is from the post correction period of 2008, indicating clear uptrend. No need to be a technical analyst or a Market Expert. It gives a guideline of Market behavior. 

As a Analyst, I will complete the Next part of Analysis, The Next Chart is a little closer look at the recent zone of the weekly chart. 


here we see the Index completed a short term downtrend, it was a part of the Long term uptrend, in short trend within a trend to complete the movement from the top of the channel to the support of the channel, The downward trend completed and the trendline pierced upward to resume the uptrend. 

The Red Circle shows the price moved above the mid channel line and also the horizontal resistance line to show the strength and entered the upper channel with further space for more upmove. 

Moving further we will see a Daily chart 


here we see clear picture for the short term move, The Price is currently moving in rising channel and now above the mid channel line with strong support, While entering the rising channel and completing the down move, chart created Inverted Head and Shoulder Pattern, where the Neckline of the pattern is resting around 17091 level. The Low of Head is placed around 13300, which gives a distance of 3700 points. The Index Crossed the Neckline and moved up, Reversed to test the neckline again and resumed the uptrend. 

The Target of this pattern is 3700 points from neckline which comes around 20700-20800.

at present the Index is Trading at 18600 level, with a strong support around 18400 - 18080 and a resistance around 18880.

As per current scenario of Global Markets and sentiments, Markets are still in strong uptrend and the Constituents of the Index, all major Banks are still in good strength supported by the strong reversal in Banking stocks all over the World. Overall supporting the up move of the index and restricting the downside. 

Recommendation : 

For Traders :
I will recommend to BUY BANKNIFTY on All dips towards 18400 & 18080 (which is a rare possibility at current level) with a Stoploss around 17800 and take profit  at 19200 - 19900 - 20400 - 20800. 

Keep Trading in the range as the move will not be one sided move. There will be ups and downs, But the direction should be Buy on Dips instead of Sell on Rise. 

If you want to carry the trade, Keep Trailing Stoploss, to protect profits. 

For Investors : 
Investors who want to enjoy the Rally May Buy BANKNIFTY ETF units.. 
Bankbees, KotakBkETF, SETFNIFBK, RelBank, EBank are available options. 

Speculators : 
Small Risk Takers may BUY BANKNIFTY 19000 AUG CALL around 200-240 levels. Current closing Price is 296. Lot size is 40, Approx Risk 8000+ 

Follow Strict Risk Management Before Entering the Trades and Consult your Investment Advisor for guidelines. "Do not jump in the trade" without considering the risk. 

Enjoy Trading, Trade Safe, Trade Wisely !! 

________________________________________________________________

Disclaimer : 
The Analyst May or May not have trading positions or Investments in suggested Instrument, The Trade is Long Term and the Analyst may recommend the trade to his clients time to time for short term trading. short term reversal trades May be advised in this duration and it will be according to the charts. 

The Analyst is a SEBI Certified Investment Advisor and Global Market Expert having Vast experience of Financial Markets in India and Across the Globe. Running Analysis Services and Advisory since Last 6 years for clients across the world in Stock Markets, Forex, and Commodities. 

Contact Details :: 
WhatsApp & Telegram +91 8275 298 208 /  Email : 4x.magician@gmail.com   
________________________________________________________________
  

Tuesday, July 12, 2016

MCX India Ltd : Worst is Over ??

Hello Friends, 

Suddenly came across a stock, which I ignored most of the times for whatever reasons. 

The Stock is MCX India Ltd. yes, The Stock is on Our Radar with a Good Formation. I don't mind trading the stock if the formation is good on chart and the Business model also follows the same. 

MCX India is a big player in Indian Commodity Markets and MCX India Ltd. is a key partner in establishment and development of Commodity Exchange in India. The Business model is attractive with a Big Market share in the field and where the earnings are automated through Commissions. The stock saw a Sharp sell off after the Spot Exchange failure. After the Sell off, Now things are settled down and the stock is witnessing increased attention by traders and investors with a rising chart formation. 


Look at the Daily time frame chart, We see a Breakout from the Falling trend and price crossed the trend line resistance shown by the Red colored line. After breakout price retested the trend line and reversed to continue it's uptrend. While Moving above the trend line resistance, the price formed a Rounding Bottom formation, which is considered as a reversal chart pattern after a falling trend and it is considered as a successful chart pattern having best success ratio. 

The Neckline of the Rounding Bottom is around 1065 level and the Bottom is around 720-730 levels. it gives a Rounding Bottom/ Saucer height of 330+ points. The Stock price managed to breakout above the Neckline area which is considered as a tough resistance. 

Next Chart will be on Weekly Time frame and it will be a shock for traders and investors.. 


This is a Weekly time frame chart showing a Huge Cup and Handle Chart Pattern formation. Stock is currently trading near the Neckline around 1074 level.The Neckline resistance is around 1090 levels. It will act as a Tough Resistance. 

If we remove the Cup and Handle Drawing, considering the upper trend line and the lower trend line, we can see the price is moving in a triangle and the chances of breakout are good if Market moves in bullish mood for next couple of weeks. we need the price to move above the trend line resistance which is ultimately the Neckline of the formation. 


In this Chart on Daily Time frame, We clearly see a Rising Channel Formed by the Stock price and at the Last Stage, Moved out of the Channel indicating more Fresh upside. 

Now we have some immediate Resistances to cross ahead... 
Current Market Price as on 2.10 am on 12th July 2016 is 1074.05

Next immediate Resistance zone is upto 1100 ... Multiple resistance are playing out in the 30-40 Rs. zone. Once 1100 is crossed 1140 and 1185+ are 2 Resistance. While on the Down Side 1040 & 1010 are 2 good supports. 

The Chances of Price above 1100 are more, but never jump in any trade. If 1100 is not crossed decisively, we might see a Good Correction in the Stock, which will last for many days and will be big correction of 100-200 points to reach the Rising channel support. So trade cautiously and follow strict Risk / Money Management. 

We Recommend :

BUY MCX India Ltd. above 1100 with a Stoploss of 980 levels and a Take Profit around 1280 - 1440 and Much More.


-----------------------------------------------------------------------------------------
Disclaimer :
The Analyst does not have any holdings or any vested interest in the recommended stock. The stock may be recommended to our clients, We suggest proper Risk Management before entering the stock. Consult your Investment Advisor before entering the stock.

The Analyst is a SEBI Certified Investment Advisor and Global Market Expert having expertise in technical analysis and working as an Advisor and Fund Manager for Clients across the world since last 6 years. Having an Experience of Investing in Stock Market of about 8 years. You may Contact the Advisor for Queries and Services through WhatsApp and Email
WhatsApp : +91 8275 298 2008 / Email : 4x.magician@gmail.com
-----------------------------------------------------------------------------------------