Hello All and Welcome Back!
NIFTY PSU BANK INDEX
In today's analysis, we dive deep into the world of financial markets, specifically the NIFTY PSU Bank Index on the National Stock Exchange (NSE). This index, comprising 12 prominent banks, is a key barometer of the banking sector's performance in India. Let's See Some Characteristics of The Index in Short :
Before we delve into the nitty-gritty details, let's introduce you to the lineup of these 12 banks, as displayed in the image below.
Now, let's take a snapshot of the index's current status. As of Thursday, 7th September 2023, the NIFTY PSU Bank Index stands at 4691.30, based on the closing prices.
-----------------------------------------------------------------
Free WhatsApp Group : https://bit.ly/3EqWIPA
Free Telegram Channel : https://t.me/pratham_inv
-----------------------------------------------------------------
But numbers alone don't tell the whole story. To chart the future course of this index, we need to understand its past. So, fasten your seatbelts as we embark on a journey through time, analyzing the historical price movements. We'll decipher the short-term trends and also cast our gaze further into the horizon to explore the long-term prospects.
To kick things off, we'll begin by scrutinizing the monthly chart. This bird's-eye view will provide us with valuable insights into the index's journey since its inception.

Monthly Chart Highlights:
The historical journey of the NIFTY PSU Bank Index has been nothing short of a rollercoaster ride. It reached its all-time high of 4640 on 27th April 2011, only to endure turbulent times ahead. The banking sector faced its fair share of challenges, including high-profile scams and a surge in non-performing assets (NPA).
However, the winds of change began to blow as the PSU banking sector underwent significant restructuring. Mergers and acquisitions, coupled with a broader overhaul, breathed new life into these banks. Then came the COVID-19 pandemic, which tested every industry, banking included. The index hit its pandemic low at 1080 before mounting a remarkable recovery.
A significant turning point emerged with the formation of a Cup and Handle pattern, a bullish technical indicator. The neckline of this pattern, situated around 3111 levels, served as a crucial breakout point. According to the rules of this pattern, the depth of the cup (2000 points in this case) represented the potential breakout target – 5111. which is Yet to be Achieved and We are Very Close to Achieving it !!
The index made its first attempt to breach the all-time high in December 2022, reaching 4617 levels but faced a pullback. It made subsequent attempts in July and August 2023, successfully crossing the all-time high barrier but falling short of closing above the previous record of 4640.
The wait lasted long, but it finally happened. On 4th September 2023, the index not only breached the all-time high but did so on a closing basis, marking a significant milestone in its 12-year+ journey.
Daily Chart Analysis:
Now, let's zoom in for a closer look at the recent price momentum by dissecting the daily chart.

Zooming into the daily chart, we uncover a fascinating story of price dynamics. Since June-July 2022, the index has been riding along a steadfast rising trendline, signaling underlying strength.
In December 2022, the index flirted with the idea of breaking free, reaching a high of 4617. However, it wasn't quite ready for the grand ascent. Instead, it embarked on a brief retreat, retesting the dependable rising trendline. What followed was a compelling maneuver.
The index formed a rounding base structure, indicating a period of consolidation and accumulation. This formation laid the foundation for what we see today—a Bullish Flag and Pole structure.
Bullish Flag and Pole Analysis:
The Bullish Flag and Pole pattern is characterized by a strong upward move (the pole) followed by a period of consolidation (the flag). In this case, the pole's height measures an impressive 700 points, ranging from 3960 to 4660 (approximate levels).
Now, here's where it gets exciting. The breakout above 4660 is significant, as it implies a potential continuation of the bullish trend. According to the pattern's principles, this breakout could trigger a move equal to the pole's height above the breakout point.
So, with a breakout above 4660, we might anticipate a potential surge of 700 points, taking the index to approximately 5360. It's worth noting that this target aligns harmoniously with the monthly Cup and Handle pattern, which previously hinted at a target of 5111.
Conclusion:
Intricately interwoven patterns and historical context paint a promising picture for the NIFTY PSU Bank Index. While past attempts at breaking the all-time high have been mere teases, the current setup suggests that this time, the index might have what it takes to not only break the barrier but also establish a new high above 5360.
--------------------------------------------------------------------------------------------------------------------
Now Let's Have a Look at Some Comparison of 1 Year Performance as of Aug 31, 2023.
Let's See The Returns Generated by the Index on a Longer Time Frame as We have seen a Long Period of Correction here. It's Interesting to know how the Index has Performed.
Digging deeper into the Index construction, Let's Understand the Weightage of Different Banks in this Index, so We can Focus on the Banks independently.
So The TOP 4 Banks Carry The Weight of Almost 70% (69.81% to be Precise) in the Index, Rest of the 8 Banks are Not included in F&O Segment, Are available Only in Cash Segment.
--------------------------------------------------------------------------------------------------------------------
Let's Analyse All 4 One by One.
Starting with the Largest Weight Bank.
STATE BANK OF INDIA LTD.
Before we dive into the nitty-gritty of SBI's recent chart analysis, it's essential to acknowledge that this stock is a prominent feature in our esteemed EQUITY MARVELS service. Equity Marvels stands as a flagship service renowned for its impressive track record and precision, making it the go-to resource for investors and traders in the stock market.
Short-Term Momentum Analysis:
Now, let's focus on SBI's recent chart developments, with an emphasis on short-term momentum.
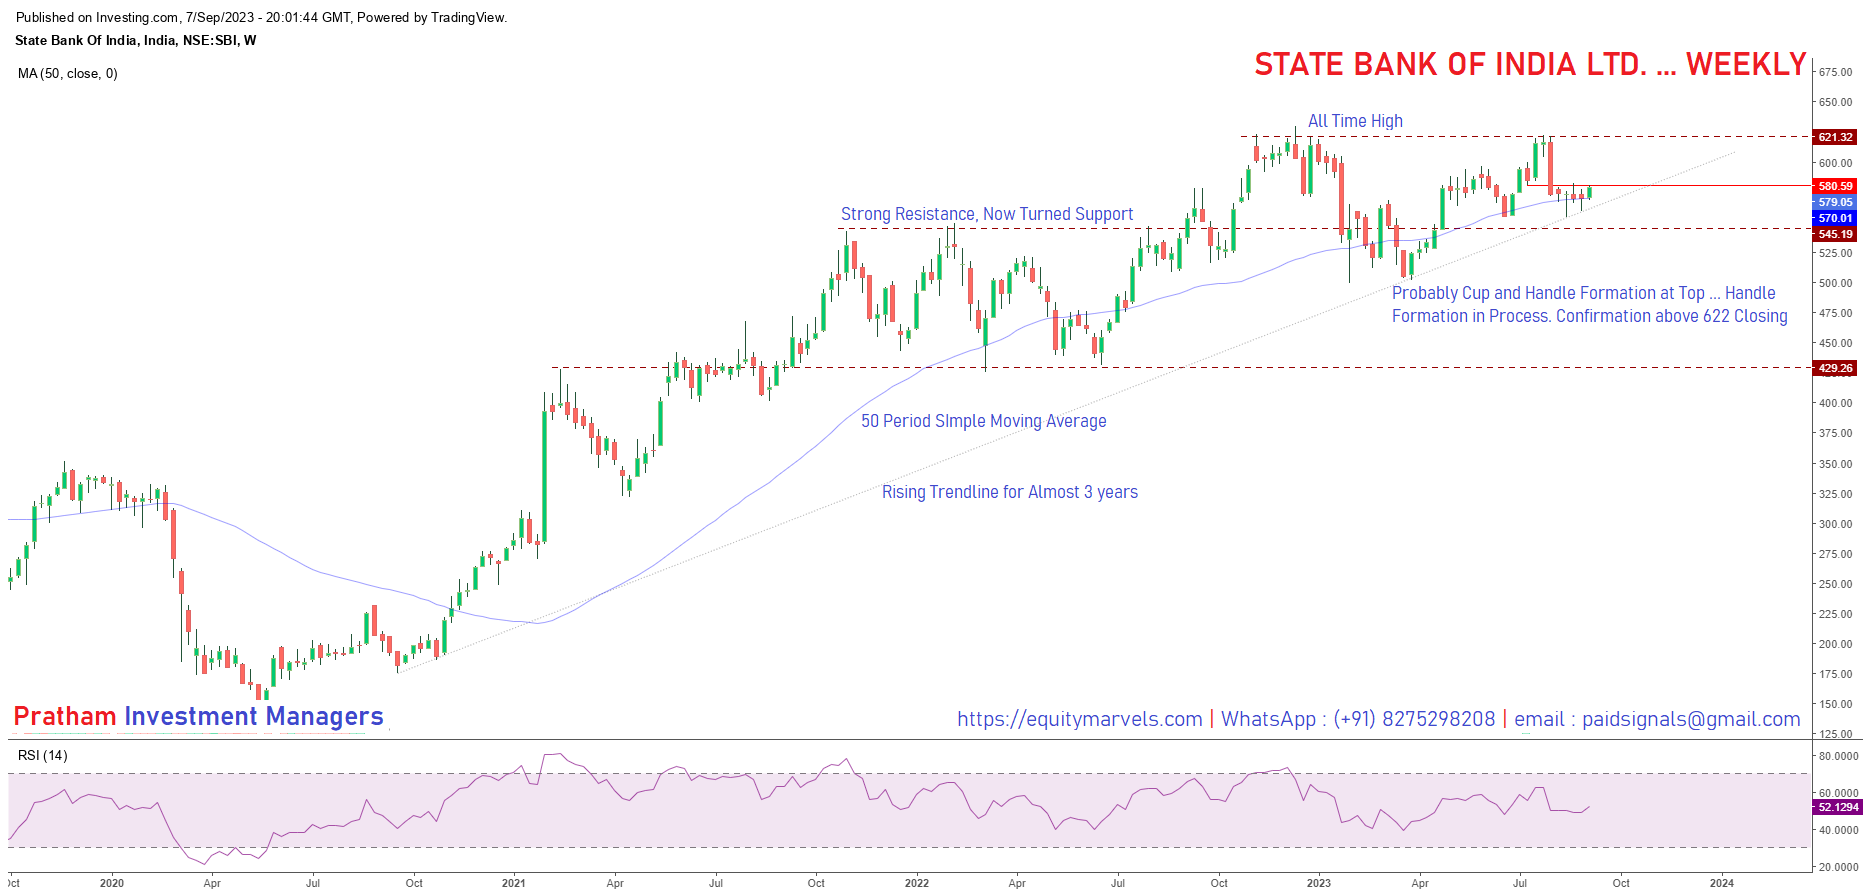
SBI has been closely covered in our Equity Marvels service since it traded within the range of 400-430 levels. At the time of writing, it stands at approximately 578-579 levels. However, what's more intriguing is the roadmap ahead.
Key Levels and Patterns:
581 Level: This is a pivotal juncture for SBI. A closing price above 581 within the next 2-3 days could trigger a bullish move towards 622 levels.
Cup and Handle Formation: The chart exhibits the formation of a classic Cup and Handle pattern. The cup area is already complete, and the handle is currently in the making. This pattern is a potent bullish indicator.
Breakout Above 622 Levels: If SBI manages to conquer the 622 levels, it would signal the completion of the Cup and Handle formation, setting the stage for a potentially significant upward move.
Price Targets:
In case of a breakout above 622 levels, the stock could be headed for a remarkable journey, with a target exceeding 722.
--------------------------------------------------------------------------------------------------------------------
For More Details about EQUITY MARVELS ... Visit The Website Here >>>
--------------------------------------------------------------------------------------------------------------------
Next Bank on Our Radar Will be
BANK OF BARODA LTD.
Bank of Baroda Holds Second Largest Weight in the Nifty PSU Bank Index and It carries a Weight of Almost 19% as of now.
Let's Have a Look at the Chart First, so We Can Discuss about the Details :

As we gaze upon the chart, a long period of consolidation becomes evident, resembling a rounding base formation. This sustained movement appears to have found support along the 40-period Simple Moving Average (SMA) and, more recently, by a rising trendline over the past year.
The Journey to 211 Levels:
Bank of Baroda recently reached a high of 211, but let's rewind a bit and explore what happened leading up to this significant milestone.
The Bullish Cup and Handle Formation:
A closer examination reveals the formation of a classic Bullish Cup and Handle pattern. This pattern is a powerful indicator of potential bullish momentum.
Breakout Above 190 Levels: The Cup and Handle formation exhibited a compelling breakout above the neckline, situated around 190 levels. This breakout was followed by a swift upward move.
Retracement and Current Momentum: After the initial surge, Bank of Baroda retraced towards the neckline support and the rising trendline support. The current weekly candle presents a strong reversal signal, hinting at the possibility of a fresh breakout.
Price Target:
If this breakout materializes as expected, it could propel the price towards the target associated with the Cup and Handle pattern. The depth of the cup, approximately 40 points, suggests a breakout target of 230.
As Bank of Baroda charts its course, keep a keen eye on this intriguing setup. A successful breakout above current levels could pave the way for a substantial move towards the 230 mark.
--------------------------------------------------------------------------------------------------------------------
Moving Ahead to the Next Bank :
PUNJAB NATIONAL BANK LTD.
Let's Go Directly Towards the Chart,
Firstly, it's crucial to note that PNB has been entrenched in a long-term falling trend, one that hasn't yet officially concluded as the stock remains under the influence of a trendline resistance.
Consolidation and Bullish Cup and Handle Formation:
However, amidst this downward trajectory, PNB embarked on a significant period of consolidation, laying the groundwork for a promising development—a Bullish Cup and Handle formation.
Successful Breakout and Potential Upside:
The breakthrough moment arrived when PNB successfully broke out from the neckline of the Cup and Handle formation. Although the stock currently lingers near the neckline, it seems poised for a swift move forward.
Now, the question is, where could this potential move take PNB? The target associated with the Cup and Handle pattern suggests an upside potential. With the current stock price hovering around 68 levels, the Cup and Handle formation's target zone extends to approximately 91 levels.
Momentum on the Horizon:
As PNB charts its course, keep a close watch on this intriguing setup. The stock's momentum is expected to gain traction above the 70 level, potentially paving the way for a substantial upward move.
It's worth noting that PNB's propensity to enter the F&O ban list has likely impeded its ability to create substantial movements. Nevertheless, the chart paints a picture of untapped potential, and as conditions evolve, the stock may be poised for a noteworthy journey.
--------------------------------------------------------------------------------------------------------------------
Last Bank in The List is
CANARA BANK LTD.
Here is the Chart for the Same :
An Amazing Chart on the Weekly Timeframe:
Prepare to be amazed as we dive into the captivating world of technical analysis with a remarkable chart on the weekly timeframe. This chart tells a compelling story of a stock that has not only broken free from a longstanding falling trend but is now gearing up for a journey to new heights.
Breaking Free from the Falling Trend:
First and foremost, it's crucial to recognize that this stock has broken out of its long-held falling trend. Not only did it breach the trendline, but it also had the strength to retest it, cementing its newfound upward momentum.
The Bullish Cup and Handle Pattern:
But that's not all; the excitement continues with the formation of a Bullish Cup and Handle pattern. This pattern is a potent indicator of a potential bullish surge.
Successful Breakout: The Cup and Handle pattern experienced a successful breakout, marking a crucial turning point.
Neckline Retest: What's more, the stock revisited the neckline, solidifying the newfound support at the same level.
Now, the question on everyone's mind is: where is this stock headed next? The short-term target for this bullish breakout points towards 373 levels in the upcoming September series.
But the excitement doesn't end there. The ultimate target associated with the Cup and Handle breakout reaches a lofty 422 levels, and indications suggest that this ambitious goal may soon be within reach.
Buckle Up for the Journey:
As we prepare to embark on this exciting journey with the stock, it's essential to stay tuned for further updates. The chart tells a tale of untapped potential, and as the stock continues to evolve, there's a sense that we may be on the cusp of witnessing something truly remarkable in the coming weeks.
So, fasten your seatbelts, traders and investors, because this stock is gearing up for a ride to remember.
--------------------------------------------------------------------------------------------------------------------
One Important Update Here :
We Have Already Given SBI in Our EQUITY MARVELS Series, 2 More Stocks From PSU Banking Space will be Covered in EQUITY MARVELS, But Unfortunately Those 2 Will not be Shared in Public Forums and The Targets will also be Updated along with a Research Report to Our Members Only !! Not a Member of Equity Marvels Yet ? Join Today and Start your Journey towards The Financial Independence
Register on The Website and Get 25 Hidden Gems Hand Picked for you over a duration of 1 year.
--------------------------------------------------------------------------------------------------------------------
One Important Update Here :
Some Specialised Services are Open For Registrations for Limited Numbers Only.
PMS Services For Equity as Well as F&O Segment are Open and We Have Space for a Limited Numbers Only.
--------------------------------------------------------------------------------------------------------------------
#India #Stockmarket #Stocks #Stockstobuy #Stockstowatch #Stockstotrade #StockstoInvest #Investment #Trading #Investors #Traders #Tradeideas #Tradingtips #Stocktrader #Investmenttips #Investmentadvisory #equitymarvels #Advisory #Funds #Tradingstrategies #Stocksinfocus #NSE #BSE #nseindia #bseindia #Nifty #Sensex #Futures #Options #Nifty50 #Banknifty #Niftypsubanks #Niftyoptions #Niftyfutures