Monday, September 18, 2017

NIFTY ... Going My Way ??

Hello Guys, 

Today's Post will be About NIFTY 

Yes, 
Nifty Closed Today on All Time High !! was it Expected ? The Guys who were Talking about big Downside in Nifty as an Index are now seen Celebrating the New All time High and are Talking about more upside today.. I mean really ?? is this the analysis they talk about ?? why they are called experts when they flip their targets with a slight move in Markets ?? are they really Experts in Predicting Market or Just Flipping their targets in a flash :) 

Anyways, How to Analyse Markets is their Own Business, We will Concentrate on Our Own .. 

Last time I Published a Chart through my Channels on WhatsApp and Telegram. Posting it again here, Just for your Info .. 


The Chart Explains in Simple Term, When Everyone was Selling, Why I was giving Buy Calls !! My Charts Show me the Way to trade and it is proven globally. I am not in competition with anyone here in India as I have been tested and approved by Global Markets. Experts are not meant to be confused on their views, They are expected to be Firm on their Views and Targets. 

Let's See What Happened Next... The Following Chart is Chart after Closing at all time high on Monday 18th Sep 2017. 


The Chart Proved my readings again, No Complex Indicators, No Complex Analysis.. In Simple Terms.. Market is in uptrend, Don't Miss the Bus.. Just Buy all the Dips, Now Market has crossed all time High to Settle at the Open Territory. My Targets are Still Far Away and I am Always Confident on My Readings... When Nifty was trading around 8000, I told my Subscribers Nifty won't fall before touching 10200 and xxxxx. This xxxxx thing I have already disclosed to many followers.. Will update here also, But not now.. Let My Subscribers Enjoy the ride First as they are Privileged Members. 

HOPE YOU ENJOYED THE RIDE till now !!

Join Our Telegram Channel For More updates and Live Trades... 

https://t.me/options2017


Disclaimer : 
Our NIFTY Plus, NIFTY Punters League and Special Options Punt Subscribers are Long with Huge Positions in Multiple Strikes and are Seating on Good Profits. 

Do Not Jump in the Trade without Risk Management !! 


Monday, September 4, 2017

AUROBINDO PHARMA LTD... :: Good Setup !!

Hello Friends,

Once Again Posting a Simple and Beautiful Chart Setup !!

Stock in Discussion Today will be : AURO PHARMA LTD. 

The Stock Currently trading @ 746 cash levels and 750 Sept Futures. 

As usual, Without wasting time let's go to the charts. 

First of all we will see smaller term chart for the first time... We usually see charts from Higher to Lower timeframe. This time it is exactly reverse. 


This is H4 time frame chart, We can see the price is moving along a rising trendline and respecting every support on the trend line. While moving on a rising trend, the stock price corrected from recent high's to reach the trendline and while correcting and reversing from trendline support, the Price is forming a Bullish Chart Pattern Called "Inverted Head and Shoulder". The Chart Pattern is Very much dependable and the results are always good. The Neckline of the Formation is placed around 750 levels and break above the Neckline will be considered as a breakout. The Neckline resistance is tough to break and a closing above the neckline is important for the confirmation of the breakout. Once breakout is done, We may enter longs and carry till the price breaks the rising trend line. The Target of the breakout is placed around 810 levels, which is a resistance at 811.95, we may place our Take Profit orders around 810 levels once entered the trades. 

After the breakout confirmation on H4 Chart, Let's see Higher time frame chart


This is a Daily time frame chart, We can see The price moving along the rising channel after breakout from the falling trendline. The Price is forming a Strong Bullish Chart Pattern Called "Cup and Handle". The Neckline is placed around 794 levels for the formation. Once the Stock crosses 794 levels and sustains above the level, we will see 893 targets in few weeks on the stock.

Important thing to look here is, smaller timeframe chart is preparing ground and supporting to gather strength for a breakout on bigger time frame. Lower timeframe breakout target comes around 810 and bigger timeframe breakout is seen at 794 level which is lower than the target of smaller timeframe breakout. So for me breakout above 750 is more important than breakout of 794, the reason is simple. Once we breakout at 750 levels, in attempt to achieve Target of the breakout, Price will automatically clear the upper breakout area leading to Higher targets. 

Stoploss for all the move will be nearest Trendline support around 725 levels. So For me Entry around 750 Levels and Stoploss around 725 levels with a Target of 890 levels will be a good trade setup, which is 25 points of Risk, and around 140 points of Reward almost 1:6 Risk Reward ratio. Anything above 1:1 Risk Reward is always Good but a 1:6 Risk Reward is always a Nice Opportunity. 

For Future Traders, Lot size of the stock is 800, So Risk is Approx 20000 and Reward will be approx 112000 at the Higher Target. 

Recommendation : 
AUROBINDO PHARMA LTD. 
Buy Above 750 Levels
Stoploss around 725 Levels 
Targets : 810 - 860 - 890 

Traders are Advised to follow proper Risk Management while entering the trade and always advised to consult your Trading adviser before Placing any trade. If you don't have a Trading Adviser, On First Priority Get associated with someone. The Adviser has posted his opinion and He Reserves all the Rights to be Wrong in his Chart reading. 

Disclaimer : 
Atul S Shinde, The Analyst and Writer of this post is a Global Market Expert and SEBI Certified Investment Adviser. He is a Independent Financial Adviser not associated with any company. He or His Clients May have trading / Investing Positions in the Analysed Stock and The Analyst doesn't have any Conflict of Interest in the analysis. 

You may reach him on 
WhatsApp & Telegram : +91 8275298208  
Free Telegram Channel: https://t.me/options2017
email : paidsignals@gmail.com 

Tuesday, August 29, 2017

What's in Store For Equities ??

Hello Friends, 

Hope you are Enjoyed the Volatility in Markets :) 

Global Equity Markets Witnessed Heavy Volatility yesterday on 29th August 2017 due to the News of North Korea Missile Fire Over The Land of Japan into the Sea. Panic Spread Over the Markets taking a toll of 1 to 2% cut on all Equity Markets globally. 

is it so Alarming ?? 

Actually the Panic is spread in Market by the Media and the Smart Investors who were Left out waiting for a correction in Stocks. They Need entry somewhere to enjoy the Bull Run and Market isn't correcting.. So SAD :) 

I have already alerted about the Global Major Index 2 Months Back on my Global Markets Blog Known as FX Magician (Visit the Link here 

The Dow Jones Industrial average Index Formed a Bullish Formation of Cup and Handle to get the strength for Higher Moves. The Breakout was Indicating a Move of atleast 1000 points. Many Analysts and Traders Laughed when I posted my Analysis. DOW Rallied almost 500 points after my post and Those who Laughed, started finding Next Resistance.. Anyways, I am Not Interested in anyone's views... Those who need to Check my Old Post May Visit here 


What is next ? 
Let's see the Chart 


The Chart Posted here is Simple Line Chart on Log Scale, The Black line represents price (Many traders these days don't know about Line Charts as they focus on Candlesticks only.) 
The Chart simply shows, price is still respecting the Neckline of the Cup& Handle and Just Came Down to Retest the Breakout zone, reversing again from 21680 level which is acting as a strong support being the previous breakout area. Price has moved above the Neckline again and Will Resume the uptrend.

Most of the times Markets need Breather to settle the Indicators like RSI from Overbought to Oversold sothat Markets can start moving again. 

So the Conclusion is .. 
Use your Brains, Don't Listen to the Crowd and Just BUY Every Dip !! This is not the end of the World yet !! 

Disclaimer : 
The Analyst Atul Shinde is Global Market Expert and a SEBI Certified Investment Adviser. The Author and His Clients are Having trading positions in the index and There might be a Conflict of Interest in the advice. You may Consult your Trading adviser before taking any positions. The Adviser always advice to Follow Proper Risk Management Before taking any trade. 

Visit Our Telegram Channel for Indian Market updates http://t.me/Options2017
May reach him on WhatsApp : (+91) 8275 298 208 
email : paidsignals@gmail.com

Sunday, August 27, 2017

Infosys Ltd :: Do we really Need to Worry ??

Hello and Welcome Back Friends, 

Hope you Guys are doing Well :) 

Today's Stock for Analysis is : Infosys Ltd. 

The Stock has been in Limelight due to recent developments in the Company.. Let's Check whether Investors really need to Worry as the Media is Showing or are there still any hopes !! 

Today I am posting Charts Provided to Our Clients on 20th Aug 2017, yes.. you are reading it right !! Already shared with our Clients a week ago.. While The Whole Market was Talking About Infosys, Our Clients were doing the Job Silently and Personally I haven't posted a Single word on my channels and WhatsApp Broadcast list regarding this Company. Going to share what I shared with our Clients.. 

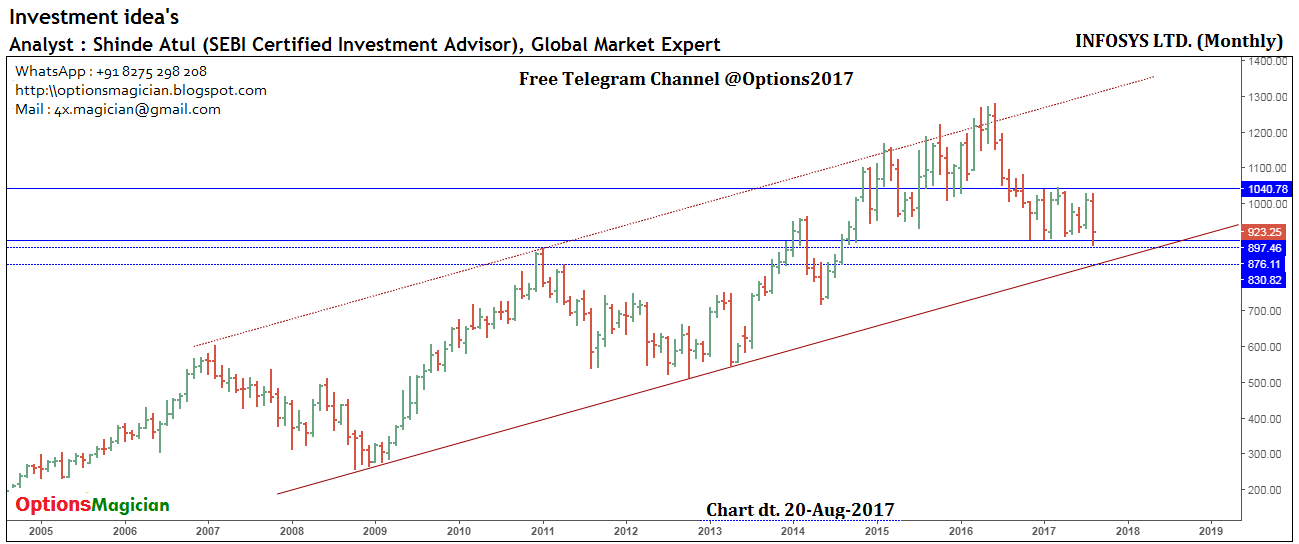
Let's See Infy Behavior on Charts, Starting from Monthly Chart.. 


This is a Monthly Chart With a Rising Channel, The Price is still assumed to be in uptrend till it breaks the Channel support and stays below. It may not happen too soon. Sorry bears :) 

Let's Move on to Weekly Chart .. 


Here we go, The Stock price is moving in a Range since a Long time and Just Breached the Lower level of the Consolidation in a panic move, But nothing to worry till the price stays in the range, isn't it Simple? Now you may have guessed what to do in the stock, Yes.. You guessed it right... Do it without hesitation and Be Confident on your Readings. Don't Bother about Analysts and Media, Let them mind their business. 

Let's Move on to Daily Chart.. 


here it is, a more closer look at the Price Action of the Stock... does it look like anything serious?? Just Check your Latest Chart.. What will you do in this case?? where is Price heading?? Simple, Anything above 897 is always a buy. Resistance will be in place around 925, Above 925 Next will be 965 immediate. 

If you have seen Weekly Chart Closely, 876 level is marked on 20th August, and Below that 830 is Marked, 830 is a Strong Confluence point which is extremely difficult to breach. With a Co-incidence, Infy Closed @ 876 on 22nd August while the Low was 860 only... Our Plain Advice to Clients was to Buy Infy at 876 and 848 with a Stoploss near 828, Following exact levels, Infy Closed @ 876 and immediately resumed upmove doing a High of 918, With Mr. Milekani taking charge again, I am Expecting Infy to Breach the 925 level with a Gap up and above 925, clear direction is till 965. It might take sometime to cross the Resistance, But One Can Expect a break above the resistance with the developments happening and Structural changes in the Management. No Need of Panic. 

Infy was Never a Buy while it was trading near 1040 levels. It is a clear Buy Only Above 1040 or Near 897 levels. Those who were talking about a Breakout Buy near 1020 levels, were talking of selling all Holding stocks below 900 levels, People are always fancied by this kind of shit and always get trapped. Once Infy Crosses 925 and Moves Near 965..Sudden a Change in View will start appearing through media and Analyst Post Illustrating How these Changes in Management of the Company is going to Help the Company and how the Stock will Outperform the Sector.. and Blah, blah, blah... 

Many Analysts will start Posting how they caught a Perfect Value Pick and all the stuff, Do you really want to follow these guys?? .. Good Luck !! 

Recommendation : 

Infosys Ltd. 
The Stock is still in Uptrend undoubtedly, No Need to panic!!
You must Time your Entries and Exit according to Levels, (Many Analysts may Sell it as a Price Action Analysis or some Difficult study, they may sell the Course at a Whopping big amount and Use Infy Chart to teach how the Stock Reacted to Price Action, Etc.) 

Buy the Stock Near 876 or Lower levels or 900 Levels With a Stop loss of 828-830 Levels with a Price Target of 925 - 965 - 1020 - 1040... Book Your Profits Near 1040 and Stay on Sidelines... If The Stock Crosses and Sustains above 1040 levels.. buy as much as you can, yes.. as much as you can for a Price Target of 1200 - 1300 - 1400 .. approx levels. It will be the Faster Rally above 1040.. Till then Just Play the Tennis ... Tic-Toc, Tic-Toc... 1040-900-1040-900-1040... 
Good Luck !! 

Disclaimer : 
Atul S Shinde is a Global Market Expert and a SEBI Certified Investment Adviser. Globally known as FX Magician. The Adviser is a Technical Analyst having experience of more than 10 years in Global and Domestic Markets. The Adviser is not having any personal investment in the stock but his clients may have the trading positions. The views are unbiased and no Conflict of Interest in the above analysis. Traders and Investors are advised to take Opinion of their Trading Adviser before taking any positions. The Adviser is not liable to any losses occurring due to blind following without risk management on this advice. You are always adviced to follow strict Risk management and Trade leveraged. 

To Follow The Analyst's Free Updates Join his Telegram Channel at https://t.me/options2017  can reach the adviser on WhatsApp : +91 8275 298 028 or on Mail at paidsignals@gmail.com 

Wednesday, July 5, 2017

ALUFLUORIDE LTD. :

Hello Friends, 

BACK Again with a New Stock Idea 

Today's Stock : ALUFLUORIDE LTD. (BSE) 

As usual, it is Purely a Technical Analysis and All Possibilities of going wrong are open, Trade as per your Conviction or Study. 

Let's Start with a Chart 


This is a weekly chart of the Stock, where we find the chart has been moving in a rising channel and Broke the resistance line of the channel to move in higher levels above the channel. Recently the Stock has corrected and reached the Upper Line of the Channel. The Stock price is getting good support at this level and simultaneously creating a Bullish Flag Pattern.The Pattern indicates a Strong upmove in near term. 

I Recommend the Stock to be Added in Portfolio for Good Returns. 


RECOMMENDATION : 

Buy Alufluoride Ltd in Price Range of 58 - 62 with a Stoploss around 52 and Targets of 110. 

The Risk associated in this trade is approx Rs. 10/- per share from a Buying price of 62 and Rs. 6/- per share from a buy price of 58 

The Reward in this trade is approx Rs. 45/- per share from the highest buying level and Rs. 49/- from the lower buying level. 

The Risk : Reward is favorable and the Trade can be added with a 5% exposure in your Portfolio. 

Disclaimer : 
The Author is a Global Market Expert and SEBI Certifies Investment Adviser having experience of almost 10 years in stock markets. The Author may or May not have direst exposure in the stock, but the stock is definitely recommended to our clients for Investment in Our Equity Pro & Equity Plus trading packages. Do not Over trade and do not Jump in the trade without Consulting a Financial Advisor. Follow Proper Risk Management. 

For More trades.... JOIN our TELEGRAM CHANNEL @options2017, 
Link for the same is https://t.me/options2017


Tuesday, May 16, 2017

SARDA ENERGY MINERALS LTD.

Hello Guys, 

Posting after a Long Time. Enjoying rally in Market, Hope you guys also enjoyed the move !! 

Our WhatsApp and Telegram Members are Enjoying Consistent Profit.

Today's Stock : SARDA ENERGY MINERALS LTD.

As usual I will be Analyzing the stock with the help of charts only, Lets' See how the stock is moving on Longer term charts

Weekly Chart for Study, 


Chart Posted above is a Weekly Chart, The Stock is forming a classic Cup & Handle Pattern with Neckline around 275 level. While Forming the Cup & Handle Pattern, Stock is moving in a Consolidation for a long period in the Handle area. and now trying to breakout, The Breakout is simultaneously seen on a Falling Trendline. The Strong Resistance zone is seen around 275-277 area. Once the stock crosses 275-277 area and sustains above the neckline. We might see big moves in the stock. The Stock will gain momentum and the targets for the breakout will be 310 - 340 - 400 - 460

Obviously, The stock will not move one sided to the targets specified. The timeframe for the required targets will be approx 6-8 months.

Trade with Caution and follow proper Risk Management. 

Always remember all the Targets and levels mentioned here are purely based on Technical Analysis and I have rights to be wrong in my readings. I am a SEBI Certified Investment Adviser but not registered with SEBI, due to my work in International Markets. Follow the levels strictly and trade accordingly. 

Recommendation :

SARDA ENERGY MINERALS LTD.
Buy Range : 277-280
Stoploss : 260
Targets : 310 - 340 - 400 - 460 

Risk : 20 Rs.
Reward : 180 Rs. till Final Target. 

The Stock may or May not be in my Personal Portfolio, but might be recommended to my clients. No Conflict of Interest in any case, Professional Advice. 

#sardaenergy, #sarda, #nse, #bse, #trading, #investing, #stocks,

Tuesday, March 7, 2017