Hello All !!
Back Again with my Market Analysis on Global Indices... Reason of the Post is Just a Quick Crash Today and Started Getting Many Queries...
We Will See Only 2 Indices Today ... After this Analysis, Just Scroll Down the Blog and Read Earlier Analysis. Compare the two Posts and Then you will Find How My Analysis Works !!
Starting With
DOW JONES (US30)
This is a Chart From My Trading Terminal, So Ignore the Setup.. Just Focus on What's Happening. This is a Weekly Chart, My Supports and Trendlines are Always Marked here. I Don't See any Reason to Panic yet, The Only Thing Worrying is the Bearish Piercing Candle. The Week is not complete yet and The Support is also not touched yet. So We may See a Quick Drop Tomorrow and then a Sharp recovery to make a Stronger Bullish Candle on Daily Chart to Avoid Further Fall.
Let's Move on to Next Chart
This is My Regular Setup to Watch Charts.
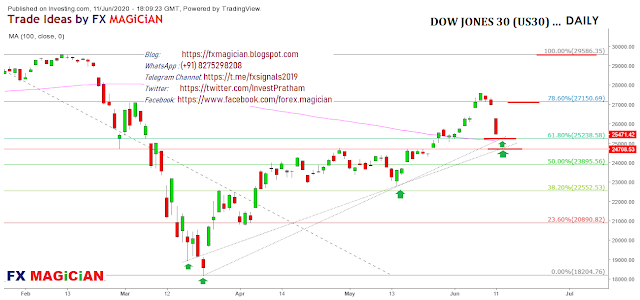
This is Just a Daily Chart and I Can See The Price Moving in a Rising Channel, Current Fall is a Attempt to Touch the Lower Support of the Rising Channel, so they can make More Room For Upside (my View).
The Price will be Finding Support with
A 100 Day Simple Moving Average
A Rising Channel Support
A Trend Line, Marked in Dotted Gray Color
A Strong Support Line Marked in Strong Red Color
Everything May be Invalid for a TOO STRONG Reason to Fall. But With FED Pumping Money and Global Lock Downs Ending every where, Life Warming up For Businesses.. It Looks Difficult to break.
One More Daily Chart with a Slightly Different Setup. Here We Can See 2 Trendlines, Support and Fibo Retracement Levels.
Now you Can be Sure of DOW Fall Getting Slower and Coming to Halt due to Multiple Supports on the Chart. Upside Potential is Big and With Current Risk : Reward Ratio.. I won't Say market is Bearish.
This is a Smaller Time frame Chart.. 4 Hr. Chart For More Clear Picture.
In this Chart I have Plotted a 50 Period Simple Moving Average to See The Rising Channel Support Perfectly matching the Moving average. The 2 Supports are Marked and The Resistance also.
As per the Charts, I will be Looking at a Opportunity to Long with a Small SL and Big, Very Big Targets.
Last Analysis on the Index Proved Very Correct, Generating Nearly 3000 Points in the Trade. Those Who Have Missed the Rally, May be this is your Chance to Enter again with a Small SL for another Big Set of Rally. This Time I Will be Looking at a Target of 30,000 and Above. Simply Put, I will be Happy to Set a SL of 24700 and a Entry Near 25000 For a Target of 27400 - 30000+ ... 300 points SL and 5000 Points upmove. Though this will not be a Simple One Way Rally as Adviced Earlier.
We Will be seeing many Roller-Coaster Rides Like Current Fall. But the Trend is Still Unchanged For me. Those Who are Happy Trading 200-300 Points May feel Trend Change on their 10-15 min Charts. But the Charts say something different.
Moving on to Next Index
NIFTY 50
The Indian Broader Index.
The Chart here is a Daily Chart, Similar to DOW Chart.. We Can see a Rising Channel and Price Moving within the Channel. The 100 Period Weighted Moving Average is Supporting in Between to Horizontal Support Lines. 9720 & 9580. These 2 Supports are Strong and Simultaneously Supported by a Moving Average Support and a Rising Channel Support. Multiple Supports in a Small Area.
You May also watch a Fibo Retracement Pattern. A Sustained Move and Reversal Move Above 9872 will Confirm Our Next Target of 10430. and 11222. I have Mentioned This Last Target on My Earlier Index Analysis on My Indian Market Blog Under the Series of MARKET OUTLOOK. You Might Like to have a Look at the analysis. CLICK HERE
Hope You will Find it Useful !!
The Blog Post is Created in a Hurry, if any Spelling and Analysis Mistakes are found please understand the efforts.
-----------------------------------------------------------------------------------------
Declaration:
The Analyst, SHINDE ATUL S. is a Financial Adviser by Profession. He is Having an experience of nearly 13 years in Stock markets in India and Around the World with a Client base spread across the World for Indian as well as Global Market Advisory. The Readings are Completely based on Analysis of Charts and The Analyst possesses all the Rights to be Wrong in his analysis.
The Analyst, SHINDE ATUL S. is a Financial Adviser by Profession. He is Having an experience of nearly 13 years in Stock markets in India and Around the World with a Client base spread across the World for Indian as well as Global Market Advisory. The Readings are Completely based on Analysis of Charts and The Analyst possesses all the Rights to be Wrong in his analysis.
Consult your Financial Adviser, Manage Risk, No Leverage, Positional holding with patience.
-----------------------------------------------------------------------------------------
Stock Market Advisory : (+91) 8275 298 208
Stocks and Mutual Fund Related : service@planmymoney.in
For Paid Services : paidsignals@gmail.com
For Training Programs on Technical Analysis : training@technicalanalysis.online
-----------------------------------------------------------------------------------------
-----------------------------------------------------------------------------------------
#equityplus #equitymarvels #equity #stocks #stockmarkets #nse #bse #nifty50 #nifty #sensex #trading #investing #midcap #smallcap #largecap


